Volume (D)EMAA simple yet configurable indicator that shows recent traffic volumes.
The time period is specified as weeks/days/hours/minutes, not as bars.
Set the volume period to non-zero if you want to use a generalized double EMA instead of plain.
The ratio option will show the size of the current volume compared to the volume in the specified time period (expect to see something very non-Gaussian, say goodby to trusting your ATR and stddev, and say hello to fat tails.) With the "together" option, it compares the current volume to the both sides together (buy+sell), otherwise it compares it to just its own.
Cari dalam skrip untuk "3 ema"


Ichimoku EMA BandsSome find Ichimoku Clouds bit complicated. This simplified version is combined with EMA Bands may be profitable. Give a try!. I recommend hourly timeframe for good results. Aye! :D

[JR] Multi Bollinger Heat Bands - EMA/Breakout optionsA little, yet hopefully useful update over my previous "Multi Bollinger Heat Bands". For those who like quick visual cue's.
In short: It's your Basic Bollinger Bands, but 3 of them, and some pointy things.
In full:
Three stacked SMA based Bollinger Bands designed just to give you a quick visual on the "heat" of movement.
Set inner band as you would expect, then set your preferred additional multiplier increments for the outer 2 bands.
Option to use EMA as alternative basis, rather than SMA.
Breakout indication shapes, which have their own multiplier (but still tied to same length/period as the BB's) so you can make them pop on their own separate "band".

Candlestick Patterns With EMA and Stochastic6/11/15, Corrected barcolor errors.
Candlestick patterns identified and color coded according to position above or below 8EMA(TLine).
Special thanks to repo32, DavidR, and Chris Moody for coding ideas.
Bullish candlestick buy signals have a greater probability of success when Stochastics are oversold. Bearish ones have a
greater probability of success when overbought. Stack as many factors in your favor as possible. A candlestick signal by itself is of little value unless you apply additional information with it. An 8 EMA is coded also to help with buy/sell signals. Some of the videos by Steven Bigalow are on the Web to see how he uses it.
www.youtube.com
Regardless of systems and strategies used, make your second trade first: Know when you're going to exit. Risk management rules. Good luck and good trading.

Price above/below EMAThis script will give you red/green columns to indicate if price is above or below a certain EMA. With Candlestick charting, we are looking for price in relation to the 8 ema Trigger Line (T-Line). You can adjust this indicator to fit your need. Simple, but nice to quickly see.
Oops. Last line's title should be "Sell". Doesn't affect display though.
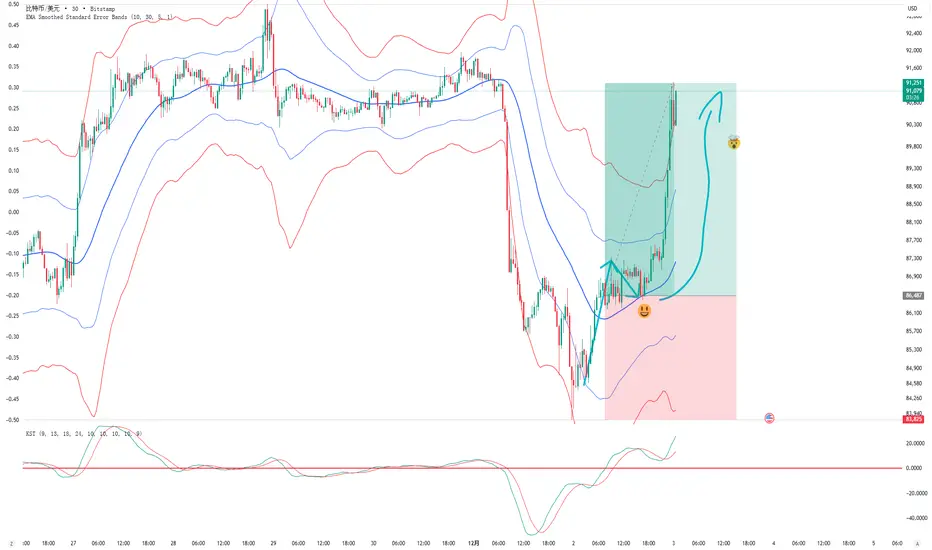
EMA Smoothed Standard Error Bands-zrbb-EMA Smoothed Standard Error Bands-zrbb-
The Standard Error Bands (SEM) indicator is primarily used in market analysis to measure price volatility, assess trend strength, and identify potential market reversals or consolidation zones. Similar to Bollinger Bands, it is typically based on linear regression lines rather than simple moving averages, providing traders with a visual range of price fluctuations around its average trend.
Specific functions include:
* Measuring Volatility: The width of the SEM directly reflects market volatility. When price trends are stable, the bandwidth typically contracts, indicating that data points are clustered around the mean; conversely, when market volatility increases, the bandwidth expands, indicating greater price dispersion.
* Assessing Trend Strength and Direction: This indicator can show the direction of the current trend and assess its strength by observing the price's position within the bands. If the price consistently touches or trades near the boundary on one side of the band, it usually indicates a strong trend in that direction.
* Identifying Overbought/Oversold Signals: While not a strictly overbought/oversold indicator, when the price touches or breaks through the upper or lower band, it may indicate that the market is in a state of extreme volatility in the short term, potentially leading to a price pullback or reversal.
Predicting Potential Trend Ends or Consolidation: When the standard error band begins to expand significantly, it can be a signal that the momentum of the current trend is weakening, and the market may be about to enter a consolidation phase or the trend may be about to reverse.
Assisting Decision Making and Risk Management: Traders use the boundary lines as potential support and resistance levels to help determine entry and exit points or set stop-loss levels, thereby managing trading risk.
In summary, the standard error band is a dynamic volatility tool that helps traders better understand market behavior by quantifying the degree to which prices deviate from their predicted trend, providing an important reference, especially in judging the continuation of trends and potential turning points.
标准误差带(Standard Error Bands)指标在市场分析中主要用于衡量价格波动性、判断趋势强度以及识别潜在的市场反转或盘整区域。它类似于布林带(Bollinger Bands),但通常基于线性回归线而不是简单的移动平均线,为交易者提供了价格围绕其平均趋势波动的视觉范围。
具体作用包括:
衡量波动性:标准误差带的宽度直接反映了市场的波动性。当价格趋势稳定时,带宽通常会收缩,表明数据点聚集在均值附近;相反,当市场波动加剧时,带宽会扩张,表明价格离散程度增大。
判断趋势强度和方向:该指标可以显示当前趋势的方向,并通过观察价格在带内的位置来评估趋势的强度。如果价格持续触及或运行在某一侧的边界附近,通常意味着该方向的趋势强劲。
识别超买/超卖信号:虽然不是严格意义上的超买/超卖指标,但当价格触及或突破上轨或下轨时,可能预示着市场短期内处于极端的波动状态,可能会出现价格回调或反转。
预测潜在的趋势结束或盘整:当标准误差带开始显著扩张时,这可能是一个信号,表明当前趋势的动能正在减弱,市场可能即将进入盘整期或趋势即将反转。
辅助决策和风险管理:交易者利用边界线作为潜在的支撑位和阻力位,帮助确定进场、出场点位或设置止损水平,从而管理交易风险。
总之,标准误差带是一个动态的波动率工具,它通过量化价格偏离其预测趋势的程度,帮助交易者更清晰地理解市场行为,尤其是在判断趋势的持续性和潜在转折点方面提供了重要参考。

EMA CrossMoving averages based trend indicator
Plots
Hull Moving average 34
Simple MA 200
Exponential MA 5
Signals on crossing and turn around points.


EMA 9×20 Multi-TF Scanner — M/W/DThis scrip will facilitate for swing trade based on momentum achieved in monthly weekly and daily


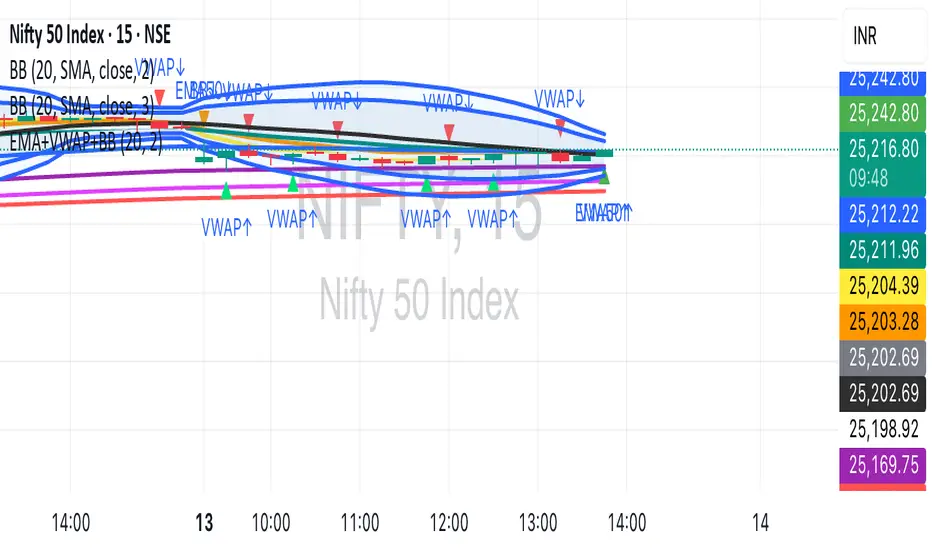
EMA (5, 10, 20, 50, 100, 150, 200)+VWAP+BBEMA Cluster + VWAP + Bollinger Bands + Alerts + Visual Signals (Fixed)
EMA/SMA Zones 9, 21, 30, 50, 100, 200 + othersMeant for swing trading on the daily chart, feel free to copy and remove/add sections as you wish (Used chatGPT for a lot of it).

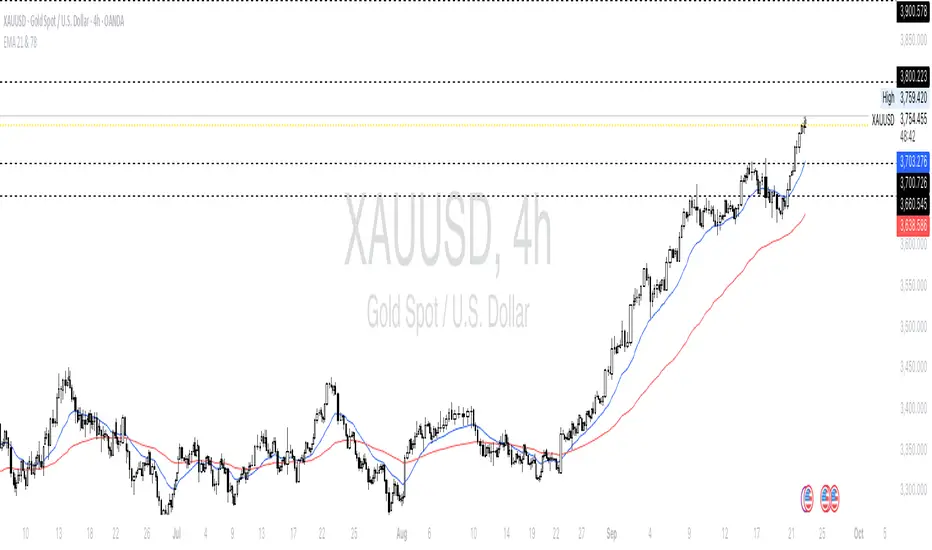
EMA 21 & 78 - With Instrument Nameonly add EMA21 and 78, I saw the 21 and 78 period is the most favor period when trading with gold